Applets:Linear Distortions of Periodic Signals: Unterschied zwischen den Versionen
Jimmy (Diskussion | Beiträge) |
Jimmy (Diskussion | Beiträge) |
||
| Zeile 15: | Zeile 15: | ||
'''Beginn Anpassen''' | '''Beginn Anpassen''' | ||
| − | The next block in the above model is | + | The next block in the above model is &bdquoMatching&bdquo. adjustment of the output signal's amplitude and phase $y(t)$ ⇒ „” allows for a differentiation between |
*attenuation distortion and frequency–independant attenuation, as well as | *attenuation distortion and frequency–independant attenuation, as well as | ||
*phase distortion and pure frequency–independant delay. | *phase distortion and pure frequency–independant delay. | ||
Version vom 23. Januar 2018, 22:56 Uhr
Inhaltsverzeichnis
Applet description
This applet illustrates the effects of linear distortions(attenuation distortions and phase distortions) with
- the input signal $x(t)$ ⇒ power $P_x$:
- $$x(t) = x_1(t) + x_2(t) = A_1\cdot \cos\left(2\pi f_1\cdot t- \varphi_1\right)+A_2\cdot \cos\left(2\pi f_2\cdot t- \varphi_2\right), $$
- the output signal $y(t)$ ⇒ power $P_y$:
- $$y(t) = \alpha_1 \cdot x_1(t-\tau_1) + \alpha_2 \cdot x_2(t-\tau_2),$$
- the matching output signal $z(t)$ ⇒ power $P_z$:
- $$z(t) = k_{\rm M} \cdot y(t-\tau_{\rm M}) + \alpha_2 \cdot x_2(t-\tau_2),$$
- the difference signal $\varepsilon(t) = z(t) - x(t)$ ⇒ power $P_\varepsilon$.
Beginn Anpassen
The next block in the above model is &bdquoMatching&bdquo. adjustment of the output signal's amplitude and phase $y(t)$ ⇒ „” allows for a differentiation between
- attenuation distortion and frequency–independant attenuation, as well as
- phase distortion and pure frequency–independant delay.
The Distortion Power $P_{\rm D}$ is used to measure the strength of the linear distortion and is defined as:
- $$P_{\rm D} = \min_{k_{\rm M}, \ \tau_{\rm M}} P_\varepsilon.$$
Ende Anpassen
Beginn Änderungen im deutschen Text:
Als nächster Block im obigen Modell folgt das „Matching”: Dabei wird das Ausgangssignal $y(t)$ mit für alle Frequenzen einheitlichen Größen $k_{\rm M}$ und $\tau_{\rm M}$ in Amplitude bzw. Phase angepasst. Dies ist also keine frequenzabhängige Entzerrung. Anhand des Signals $z(t)$ kann unterschieden werden
- zwischen einer Dämpfungsverzerrung und einer frequenzunabhängigen Dämpfung, sowie
- zwischen einer Phasenverzerrung und einer für alle Frequenzen gleichen Laufzeit.
Als Maß für die Stärke der linearen Verzerrungen wird die Verzerrungsleistung (englisch: Distortion Power) $P_{\rm D}$ verwendet. Für diese gilt:
- $$P_{\rm D} = \min_{k_{\rm M}, \ \tau_{\rm M}} P_\varepsilon.$$
'Ende Änderungen im deutschen Text:
Theoretical background
Distortions refer to generally unwanted alterations of a message signal through a transmission system. Together with the strong stochastic effects (noise, crosstalk, etc.), they are a crucial limitation for the quality and rate of transmission.
Just as the „Stärke” of noise can be assessed through
- the Noise Power $P_{\rm N}$ and
- the Signal–to–Noise Ratio (SNR) $\rho_{\rm N}$,
Distortions can be quantified through
- the Distortion Power $P_{\rm D}$ and
- the Signal–to–Distortion Ratio (SDR)
- $$\rho_{\rm D}=\frac{\rm Signal \ Power}{\rm Distortion \ Power} = \frac{P_x}{P_{\rm D} }.$$
Linear and nonlinear distortions
A distinction is made between linear and nonlinear distortions:
- Nonlinear distortions occur, if at all times $t$ the nonlinear correlation $y = g(x) \ne {\rm const.} \cdot x$ exists between the signal values $x = x(t)$ at the input and $y = y(t)$ at the output, whereby $y = g(x)$ is defined as the system's nonlinear characteristic. By creating a cosine signal at the input with frequency $f_0$ the output signal value includes $f_0$ as well as multiple harmonic waves. We conclude that new frequencies arise through nonlinear distortion.
- Linear distortions occur, if the transmission channel is characterized by a frequency response $H(f) \ne \rm const.$ Various frequencies are attenuated and delayed differently. Characteristic of this is that although frequencies can disappear (for example, through a Low–pass or a High–pass), no new frequencies can arise.
In this applet only linear distortions are considered.
Description forms for the frequency response
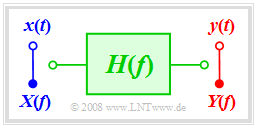
The generally complex valued frequency response can be represented as follows:
- $$H(f) = |H(f)| \cdot {\rm e}^{-{\rm j} \hspace{0.05cm} \cdot \hspace{0.05cm} b(f)} = {\rm e}^{-a(f)}\cdot {\rm e}^{-{\rm j} \hspace{0.05cm} \cdot \hspace{0.05cm} b(f)}.$$
This results in the following description variables:
- The absolute value $|H(f)|$ is called Amplitude response and in logarithmic form Attenuation curve:
- $$a(f) = - \ln |H(f)|\hspace{0.2cm}{\rm in \hspace{0.1cm}Neper \hspace{0.1cm}(Np) } = - 20 \cdot \lg |H(f)|\hspace{0.2cm}{\rm in \hspace{0.1cm}Decibel \hspace{0.1cm}(dB) }.$$
- The Phase response $b(f)$ indicates the negative frequency–dependent angle of $H(f)$ in the complex plane based on the real axis:
- $$b(f) = - {\rm arc} \hspace{0.1cm}H(f) \hspace{0.2cm}{\rm in \hspace{0.1cm}Radian \hspace{0.1cm}(rad)}.$$
Low–pass of order N
The frequency response of a realizable N grade low pass is:
- $$H(f) = \left [\frac{1}{1 + {\rm j}\cdot f/f_0 }\right ]^N\hspace{0.05cm}.$$
For example the RC low pass is a first grade low pass. Consequently we can obtain
- the attenuation curve:
- $$a(f) =N/2 \cdot \ln [1+( f/f_0)^2] \hspace{0.05cm},$$
- the phase curve:
- $$b(f) =N \cdot \arctan( f/f_0) \hspace{0.05cm},$$
- the attenuation factor for the frequency $f=f_i$:
- $$\alpha_i =|H(f = f_i)| = [1+( f/f_0)^2]^{N/2}$$
- $$\Rightarrow \hspace{0.3cm} x(t)= A_i\cdot \cos(2\pi f_i t) \hspace{0.1cm}\rightarrow \hspace{0.1cm} y(t)= \alpha_i \cdot A_i\cdot \cos(2\pi f_i t)\hspace{0.05cm},$$
- the phase delay for the frequency $f=f_i$:
- $$\tau_i =\frac{b(f_i)}{2 \pi f_i} = \frac{N \cdot \arctan( f_i/f_0)}{2 \pi f_i}$$
- $$\Rightarrow \hspace{0.3cm} x(t)= A_i\cdot \cos(2\pi f_i t) \hspace{0.1cm}\rightarrow \hspace{0.1cm} y(t)=A_i\cdot \cos(2\pi f_i (t- \tau_i))\hspace{0.05cm}.$$
High–pass of order N
The frequency response of a realizable N grade high pass is:
- $$H(f) = \left [\frac{ {\rm j}\cdot f/f_0 }{1 + {\rm j}\cdot f/f_0 }\right ]^N\hspace{0.05cm}.$$
For example the LC high pass is a first grade high pass. Consequently we can obtain
- the attenuation curve:
- $$a(f) =N/2 \cdot \ln [1+( f_0/f)^2] \hspace{0.05cm},$$
- the phase curve:
- $$b(f) =-N \cdot \arctan( f_0/f) \hspace{0.05cm},$$
- the attenuation factor for the frequency $f=f_i$:
- $$\alpha_i =|H(f = f_i)| = [1+( f_0/f)^2]^{N/2}$$
- $$\Rightarrow \hspace{0.3cm} x(t)= A_i\cdot \cos(2\pi f_i t) \hspace{0.1cm}\rightarrow \hspace{0.1cm} y(t)= \alpha_i \cdot A_i\cdot \cos(2\pi f_i t)\hspace{0.05cm},$$
- the phase delay for the frequency $f=f_i$:
- $$\tau_i =\frac{b(f_i)}{2\pi f_i} = \frac{-N \cdot \arctan( f_0/f_i)}{2\pi f_i}$$
- $$\Rightarrow \hspace{0.3cm} x(t)= A_i\cdot \cos(2\pi f_i t) \hspace{0.1cm}\rightarrow \hspace{0.1cm} y(t)=A_i\cdot \cos(2\pi f_i (t- \tau_i))\hspace{0.05cm}.$$
Beginn Änderungen im deutschen Text:
$\text{Beispiel:}$ Die Grafik zeigt jeweils für die Grenzfrequenz $f_0 = 1\ \rm kHz$ und die Ordnung $N=1$ die Phasenfunktion $b(f)$
- eines Tiefpasses (englisch: Low–pass) als grüne Kurve, und
- eines Hochpasses (englisch: High–pass) als violette Kurve.
Das Eingangssignal sei jeweils sinusförmig mit der Frequenz $f_{\rm S} = 1.25\ {\rm kHz}$, wobei dieses Signal erst zum Zeitpunkt $t=0$ eingeschaltet wird:
- $$x(t) = \left\{ \begin{array}{l} \hspace{0.75cm}0 \\ \sin(2\pi \cdot f_{\rm S} \cdot t \\ \end{array} \right.\quad \quad \begin{array}{*{20}c} {\rm{f\ddot{u}r} } \\ {\rm{f\ddot{u}r} } \\ \end{array}\begin{array} t < 0, \\ t>0. \\ \end{array}$$
In der linken (blau umrandeten) Grafik ist dieses Signal $x(t)$ dargestellt. Der Zeitpunkt $t = T_0 = 0.8\ {\rm ms}$ der ersten Nullstelle ist durch eine gestrichelte Linie markiert. Die beiden anderen Grafiken zeigen die Ausgangssignale $y_{\rm TP}(t)$ und $y_{\rm HP}(t)$ von Tiefpass und Hochpass, wobei in beiden Fällen die Amplitudenänderungen ausgeglichen wurden.
- Die erste Nullstelle des Signals $y_{\rm TP}(t)$ nach dem Tiefpass kommt um $\tau_{\rm TP} = 0.9/(2\pi) \cdot T_0 \approx 0.115 \ {\rm ms}$ später als die erste Nullstelle von $x(t)$ ⇒ markiert mit grünem Pfeil, wobei $b_{\rm TP}(f/f_{\rm S} = 0.9 \ {\rm rad}$ berücksichtigt wurde.
- Dagegen ist die Laufzeit des Hochpasses negativ: $\tau_{\rm HP} = -0.67/(2\pi) \cdot T_0 \approx 0.085 \ {\rm ms}$ und die erste Nullstelle von $y_{\rm HP}(t)$ kommt deshalb vor der weißen Markierung.
- Nach diesem Einschwingvorgang kommen in beiden Fällen die Nulldurchgänge wieder im Raster der Periodendauer $T_0 = 0.8 \ {\rm ms}.$
Anmerkung: Die gezeigten Signalverläufe wurden mit dem intereaktiven Applet Kausale Systeme – Laplacetransformation erstellt.
Dämpfungsverzerrungen und Phasenverzerrungen
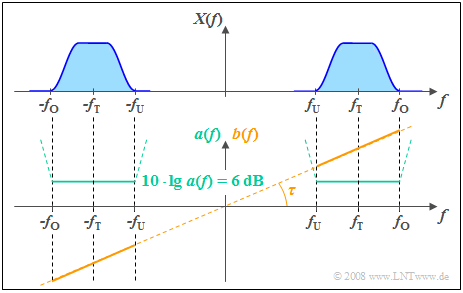
Die nebenstehende Grafik zeigt
- den geraden Dämpfungsverlauf $a(f)$ ⇒ $a(-f) = a(f)$, und
- den ungeraden Phasenverlauf $b(f)$ ⇒ $b(-f) = -b(- f)$
eines verzerrungsfreien Systems. Man erkennt:
- Bei einem verzerrungsfreien Systems muss in einem Bereich von $f_{\rm U}$ bis $f_{\rm O}$ um die Trägerfrequenz $f_{\rm T}$, in dem das Signal $x(t)$ Anteile besitzt, die Dämpfungsfunktion $a(f)$ konstant sein.
- Aus dem angegebenen konstanten Dämpfungswert $6 \ \rm dB$ folgt für den Amplitudengang $|H(f)| = 0.5$ ⇒ die Signalwerte aller Frequenzen werden somit durch das System halbiert ⇒ keine Dämpfungsverzerrungen.
- Zusätzlich muss bei einem solchen Systems der Phasenverlauf $b(f)$ zwischen $f_{\rm U}$ und $f_{\rm O}$ linear mit der Frequenz ansteigen. Dies hat zur Folge, dass alle Frequenzanteile um die gleiche Phasenlaufzeit $τ$ verzögert werden ⇒ keine Phasenverzerrungen.
- Die Verzögerung $τ$ liegt durch die Steigung von $b(f)$ fest. Mit $b(f) = 0$ würde sich ein laufzeitfreies Systemergeben ⇒ $τ = 0$.
Die folgende Zusammenfassung berücksichtigt, dass in diesem Applet für das Einganssignal stets die Summe zweier harmonischer Schwingungen ist,
- $$x(t) = x_1(t) + x_2(t) = A_1\cdot \cos\left(2\pi f_1\cdot t- \varphi_1\right)+A_2\cdot \cos\left(2\pi f_2\cdot t- \varphi_2\right), $$
und damit der Kanaleinfluss durch die Dämpfungsfaktoren $\alpha_1$ und $\alpha_2$ sowie die Phasenlaufzeiten $\tau_1 = \tau_2$ vollständig beschrieben wird:
- $$y(t) = \alpha_1 \cdot x_1(t-\tau_1) + \alpha_2 \cdot x_2(t-\tau_2).$$
$\text{Fazit:}$
- Dämpfungsverzerrungen gibt es, falls $\alpha_1 \ne \alpha_2$ ist . Ist $\alpha_1 \ne \alpha_2$ und $\tau_1 = \tau_2$, so liegen ausschließlich Dämpfungsverzerrungen vor.
- Phasenverzerrungen gibt es, falls $\tau_1 \ne \tau_2$ ist . Ist $\tau_1 \ne \tau_2$ und $\alpha_1 = \alpha_2$, so liegen ausschließlich Dämpfungsverzerrungen vor.
- Ein Signal $y(t)$ ist gegenüber dem Eingang $x(t)$ nur dann unverzerrt, wenn $\alpha_1 = \alpha_2= \alpha$ und $\tau_1 = \tau_2= \tau$ gilt ⇒ $y(t) = \alpha \cdot x(t-\tau)$.
Ende Änderungen im deutschen Text:
Vorschlag für die Versuchsdurchführung
BlaBla
(1) Für das Sendesignal $x(t)$ gelte $A_1 = 0.8\ {\rm V}, \ A_2 = 0.6\ {\rm V}, \ f_1 = 0.5\ {\rm kHz}, \ f_2 = 1.5\ {\rm kHz}, \ \varphi_1 = 90^\circ, \ \varphi_2 = 0^\circ$.
- Wie groß ist die Periodendauer $T_0$? Welche Leistung $P_x$ weist dieses Signal auf? Wo können Sie diesen Wert im Programm ablesen?
$\hspace{1.0cm}\Rightarrow\hspace{0.3cm}T_0 = \big [\hspace{-0.1cm}\text{ größter gemeinsamer Teiler }(0.5 \ {\rm kHz}, \ 1.5 \ {\rm kHz})\big ]^{-1}\hspace{0.15cm}\underline{ = 2.0 \ {\rm ms}};$
$\hspace{1.85cm} P_x = A_1^2/2 + A_2^2/2 \hspace{0.15cm}\underline{= 0.5 \ {\rm V^2}} = P_\varepsilon\text{, wenn }\hspace{0.15cm}\underline{k_{\rm M} = 0} \ \Rightarrow \ z(t) \equiv 0$.
(2) Variieren Sie bei sonst gleicher Einstellung wie unter (1) die Phase $\varphi_2$ im gesamten möglichen Bereich $\pm 180^\circ$. Wie ändern sich $T_0$ und $P_x$?
$\hspace{1.0cm}\Rightarrow\hspace{0.3cm}\text{Keine Veränderungen:}\hspace{0.2cm}\hspace{0.15cm}\underline{ T_0 = 2.0 \ {\rm ms}; \hspace{0.2cm} P_x = 0.5 \ {\rm V^2}}$.
(3) Variieren Sie bei sonst gleicher Einstellung wie unter (1) die Frequenz $f_2$ im Bereich $0 \le f_2 \le 5\ {\rm kHz}$. Wie ändert sich die Signalleistung $P_x$?
$\hspace{1.0cm}\Rightarrow\hspace{0.3cm}\text{Keine Veränderungen, falls }f_2 \ne 0\text{ oder } f_2 \ne f_1\text{:}\hspace{0.3cm} \hspace{0.15cm}\underline{P_x = 0.5 \ {\rm V^2}}\text{.} \hspace{0.2cm} T_0 \text{ ändert sich, falls }f_2\text{ kein Vielfaches von }f_1$.
$\hspace{1.85cm}\text{Falls }f_2 = 0\text{:}\hspace{0.2cm} P_x = A_1^2/2 + A_2^2\hspace{0.15cm}\underline{ = 0.68 \ {\rm V^2}}$. $\hspace{3cm}\text{Allgemeine Formel noch überprüfen}$
$\hspace{1.85cm}\text{Falls }f_2 = f_1\text{:}\hspace{0.2cm} P_x = [A_1\cos(\varphi_1) + A_2\cos(\varphi_2)]^2/2 + [A_1\sin(\varphi_1) + A_2\sin(\varphi_2)]^2/2 \text{. Mit } \varphi_1 = 90^\circ, \ \varphi_2 = 0^\circ\text{:}\hspace{0.3cm}\hspace{0.15cm}\underline{ P_x = 0.5 \ {\rm V^2}}\text{.} $
(4) Ausgehend vom bisherigen Sendesignal $x(t)$ gelte für den Kanal: $\alpha_1 = \alpha_2 = 0.5, \ \tau_1 = \tau_2 = 0.5\ {\rm ms}$. Zudem sei $k_{\rm M} = 1 \text{ und } \tau_{\rm M} = 0$ .
- Gibt es lineare Verzerrungen? Wie groß ist die Empfangsleistung $P_y$ und die Leistung $P_\varepsilon$ des Differenzsignals $\varepsilon(t) = z(t) - x(t)$?
$\hspace{1.0cm}\Rightarrow \hspace{0.3cm}\hspace{0.15cm}\underline{ y(t) = 0.5 \cdot x(t- 1\ {\rm ms})}\text{ ist unverzerrt, nur gedämpft und verzögert.}$
$\hspace{1.85cm}\text{Empfangsleistung:}\hspace{0.2cm} P_y = (A_1/2)^2/2 + (A_2/2)^2/2\hspace{0.15cm}\underline{ = 0.125 \ {\rm V^2}}\text{. } P_\varepsilon \text{ ist deutlich größer:} \hspace{0.1cm} \hspace{0.15cm}\underline{P_\varepsilon = 0.625 \ {\rm V^2}}.$
(5) Variieren Sie bei sonst gleicher Einstellung wie unter (4) die Matchingparameter $k_{\rm M} \text{ und } \tau_{\rm M}$. Wie groß ist die Verzerrungsleistung $P_{\rm D}$?
$\hspace{1.0cm}\Rightarrow \hspace{0.3cm} P_{\rm D}\text{ ist gleich der Leistung }P_\varepsilon \text{ des Differenzsignals bei bestmöglicher Anpassung:} \hspace{0.2cm}k_{\rm M} = 2 \text{ und } \tau_{\rm M}=T_0 - 0.5\ {\rm ms} = 1.5\ {\rm ms}$
$\hspace{1.0cm}\Rightarrow \hspace{0.3cm}z(t) = x(t)\hspace{0.3cm}\Rightarrow \hspace{0.3cm}\varepsilon(t) = 0\hspace{0.3cm}\Rightarrow \hspace{0.3cm}P_{\rm D}\hspace{0.15cm}\underline{ = P_\varepsilon = 0} \hspace{0.3cm}\Rightarrow \hspace{0.3cm}\text{weder Dämpfungs- noch Phasenverzerrungen.}$
(6) Für den Kanal gelte nun $\alpha_1 = 0.5, \hspace{0.15cm}\underline{\alpha_2 = 0.2}, \ \tau_1 = \tau_2 = 0.5\ {\rm ms}$. Wie groß sind nun die Verzerrungsleistung $P_{\rm D}$ und das $\rm SDR$ $\rho_{\rm D}$?
$\hspace{1.0cm}\Rightarrow \hspace{0.3cm} P_{\rm D} = P_\varepsilon \text{ bei bestmöglicher Anpassung:} \hspace{0.2cm}\hspace{0.15cm}\underline{k_{\rm M} = 2.24} \text{ und } \hspace{0.15cm}\underline{\tau_{\rm M} = 1.5\ {\rm ms} }\text{:} \hspace{0.2cm}\hspace{0.15cm}\underline{P_{\rm D} = 0.059 \ {\rm V^2}}$.
$\hspace{1.85cm}\text{Nur Dämpfungsverzerrungen.} \hspace{0.3cm}\text{Signal-zu-Verzerrung-Leistungsverhältnis}\ \hspace{0.15cm}\underline{\rho_{\rm D} = P_x/P_\varepsilon \approx 8.5}$.
(7) Für den Kanal gelte nun $\alpha_1 = \alpha_2 = 0.5, \ \tau_1 \hspace{0.15cm}\underline{= 2\ {\rm ms} }, \ \tau_2 = 0.5\ {\rm ms}$. Wie groß sind nun $P_{\rm D}$ und $\rho_{\rm D}$?
$\hspace{1.0cm}\Rightarrow \hspace{0.3cm} P_{\rm D} = P_\varepsilon \text{ bei bestmöglicher Anpassung:} \hspace{0.2cm}\hspace{0.15cm}\underline{k_{\rm M} = 1.82} \text{ und } \tau_{\rm M}\hspace{0.15cm}\underline{ = 0.15\ {\rm ms} }\text{:} \hspace{0.2cm}\hspace{0.15cm}\underline{P_{\rm D} = 0.072 \ {\rm V^2}}$.
$\hspace{1.85cm}\text{Nur Phasenverzerrungen.} \hspace{0.3cm}\text{Signal-zu-Verzerrung-Leistungsverhältnis}\ \hspace{0.15cm}\underline{\rho_{\rm D} = P_x/P_\varepsilon \approx 7}$.
(8) Für den Kanal gelte nun $\hspace{0.15cm}\underline{\alpha_1 = 0.5} , \hspace{0.15cm}\underline{\alpha_2 = 0.2} , \ \hspace{0.15cm}\underline{\tau_1= 2\ {\rm ms} }, \ \hspace{0.15cm}\underline{\tau_2 = 0.5\ {\rm ms} }$. Wie groß sind nun $P_{\rm D}$ und $\rho_{\rm D}$? Wie lässt sich $y(t)$ annähern?
$\hspace{1.0cm}\Rightarrow\hspace{0.3cm} \text{Dämpfungs- und Phasenverzerrungen. Bestmögliche Anpassung:} \hspace{0.2cm}\hspace{0.15cm}\underline{k_{\rm M} = 2.06} \text{, } \hspace{0.15cm}\underline{\tau_{\rm M} = 0.15\ {\rm ms} }\text{:} \hspace{0.2cm}\hspace{0.15cm}\underline{P_{\rm D} = 0.136 \ {\rm V^2}},\hspace{0.1cm}\hspace{0.15cm}\underline{\rho_{\rm D} \approx 3.7}$.
$\hspace{1.85cm}\text{Zusammenfassen von }\varphi \text{- und } \tau\text{-Parameter: } y(t) = 0.4 \ {\rm V} \cdot \sin\ (2\pi f_1 t) - 0.12 \ {\rm V} \cdot \sin\ (2\pi \cdot 3f_1\cdot t) \hspace{0.15cm}\underline{\approx 0.52 \ {\rm V} \cdot \sin^3(2\pi f_1 t)}$.
(9) Nun gelte $\underline{A_1 = A_2 = 1\ {\rm V}, \ f_1 = 1\ {\rm kHz}, \ f_2 = 1\ {\rm kHz}, \ \varphi_1 = 0^\circ, \ \varphi_2 = 0^\circ}$. Der Kanal sei ein Tiefpass erster Ordnung $\underline{(f_0 = 1\ {\rm kHz})}$.
- Gibt es Dämpfungsverzerrungen? Gibt es Phasenverzerrungen? Wie groß ist nun die Verzerrungsleistung $P_{\rm D}$?
$\hspace{1.0cm}\Rightarrow\hspace{0.3cm} \text{Dämpfungsverzerrungen, da }\hspace{0.15cm}\underline{\alpha_1 = 0.71 \ne \alpha_2 = 0.45} \text{; geringere Phasenverzerrungen, da }\hspace{0.15cm}\underline{ \tau_1 = 0.13 \ {\rm ms} \approx \tau_2 = 0.09 \ {\rm ms}}$.
$\hspace{1.85cm}\text{ Verzerrungsleistung }\hspace{0.15cm}\underline{P_{\rm D} = 0.074 \ {\rm V^2}} \text{ bei bestmöglicher Anpassung:} \hspace{0.2cm}k_{\rm M}\hspace{0.15cm}\underline{ = 1.6} \text{ und } \tau_{\rm M}\hspace{0.15cm}\underline{ = 0.9\ {\rm ms} }$.
(10) Wie ändern sich die Kanalparameter durch einen Tiefpass zweiter Ordnung gegenüber einem Tiefpass erster Ordnung $(f_0 = 1\ {\rm kHz})$.
- Wie groß ist nun die Verzerrungsleistung $P_{\rm D}$? Wie groß ist nun die Verzerrungsleistung $P_{\rm D}$?
$\hspace{1.0cm}\Rightarrow\hspace{0.3cm} \text{Es gilt }\hspace{0.15cm}\underline{\alpha_1 = 0.71^2 \approx 0.5, \alpha_2 = 0.45^2 \approx 0.5, \tau_1 = 2 \cdot 0.13 \approx 0.25 \ {\rm ms} \tau_2 = 2 \cdot 0.09 \ {\rm ms} \approx 0.18 \ {\rm ms}} $.
$\hspace{1.85cm}P_{\rm D} = 0.228 \ {\rm V^2} \text { ist größer und der 2 kHz-Anteil wird im Vergleich zum 2 kHz-Anteil noch mehr unterdrückt}$.
(11) Welche Unterschiede ergeben sich bei einem Hochpass zweiter Ordnung gegenüber einem Tiefpass zweiter Ordnung $(f_0 = 1\ {\rm kHz})$.
$\hspace{1.0cm}\Rightarrow\hspace{0.3cm} \text{???????????????}$
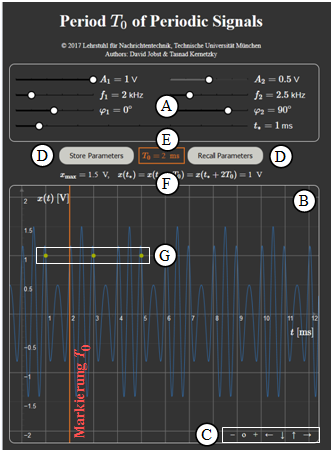
Zur Handhabung des Applets
(A) Parametereingabe per Slider
(B) Bereich der graphischen Darstellung
(C) Variationsmöglichkeit für die graphische Darstellung
(D) Abspeichern und Zurückholen von Parametersätzen
(E) Numerikausgabe des Hauptergebnisses $T_0$; graphische Verdeutlichung durch rote Linie
(F) Ausgabe von $x_{\rm max}$ und der Signalwerte $x(t_*) = x(t_* + T_0)= x(t_* + 2T_0)$
(G) Darstellung der Signalwerte $x(t_*) = x(t_* + T_0)= x(t_* + 2T_0)$ durch grüne Punkte
(H) Einstellung der Zeit $t_*$ für die Signalwerte $x(t_*) = x(t_* + T_0)= x(t_* + 2T_0)$
Details zum obigen Punkt (C)
(*) Zoom–Funktionen „$+$” (Vergrößern), „$-$” (Verkleinern) und $\rm o$ (Zurücksetzen)
(*) Verschieben mit „$\leftarrow$” (Ausschnitt nach links, Ordinate nach rechts), „$\uparrow$” „$\downarrow$” und „$\rightarrow$”
Andere Möglichkeiten:
(*) Gedrückte Shifttaste und Scrollen: Zoomen im Koordinatensystem,
(*) Gedrückte Shifttaste und linke Maustaste: Verschieben des Koordinatensystems.
Über die Autoren
Dieses interaktive Berechnungstool wurde am Lehrstuhl für Nachrichtentechnik der Technischen Universität München konzipiert und realisiert.
- Die erste Version wurde 2005 von Bettina Hirner im Rahmen ihrer Diplomarbeit mit „FlashMX–Actionscript” erstellt (Betreuer: Günter Söder ).
- 2018 wurde dieses Programm von Jimmy He im Rahmen seiner Bachelorarbeit (Betreuer: Tasnád Kernetzky) auf „HTML5” umgesetzt und neu gestaltet.


